
Thought leadership
Data Visualization and Modeling: John V. Kane on Making Regression Coefficient Plots in Stata
<p><i>This article was originally published on December 6, 2023</i></p>
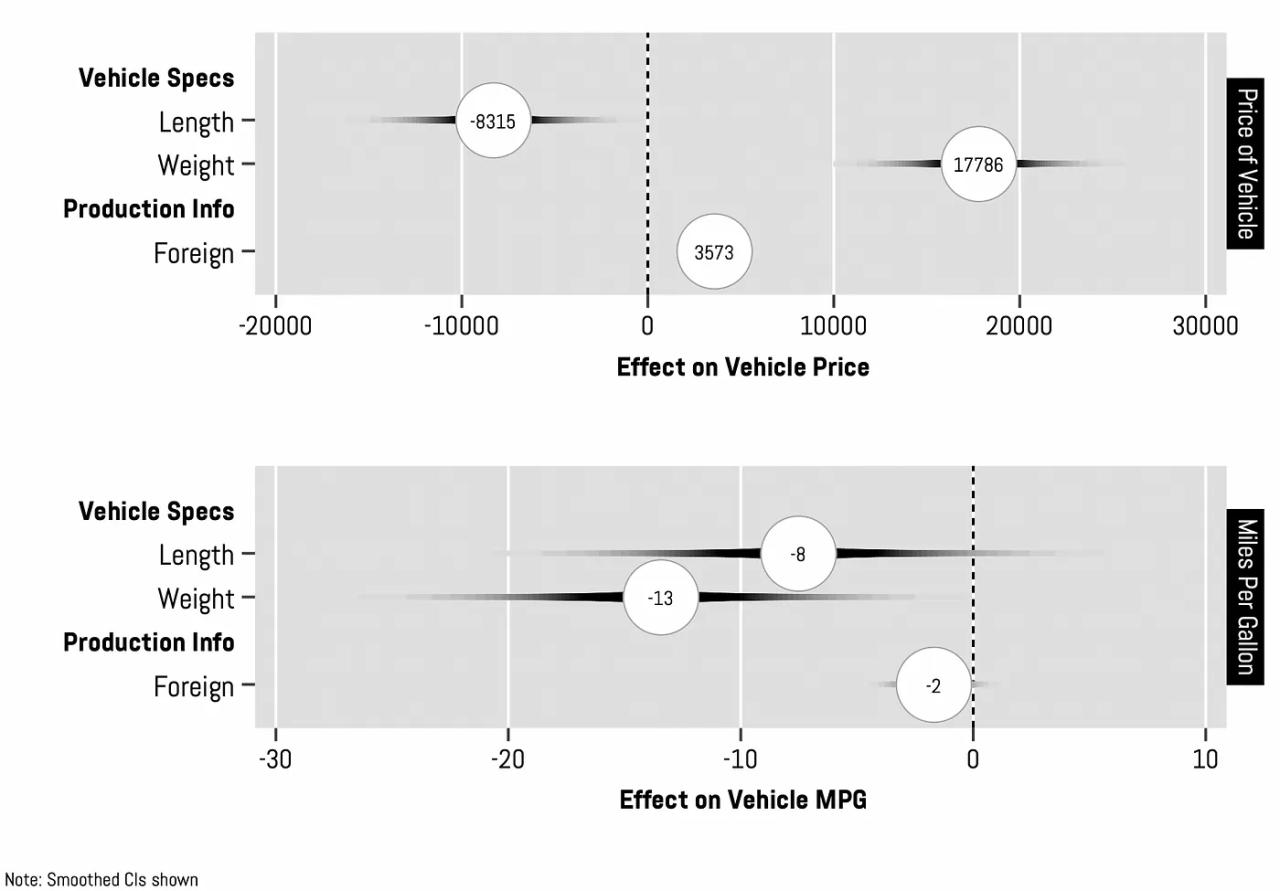
<p><span class="p-body">Center for Global Affairs Clinical Associate Professor John V. Kane offers a synoptic guide with assoicated codes for creating high-quality graphs of regression results in "Making Regression Coefficient Plots in Stata."</span></p>
<p><span class="p-body">This guide covers the crucial aesthetic modifications, integration of multiple model, binary outcome models, and various additional tips and strategies needed to establish a comprehensive approach to form rigorous representations of regression analyses. <a href="https://medium.com/the-stata-gallery/making-regression-coefficient-plots-in-stata-7b100feac0cb" target="_blank">Access the full guide here.</a></span></p>