

Last Chance Courses
Spring is underway with these February courses.
Don’t miss out! These courses are starting soon. Secure your spot before enrollment closes.
Starting Feb. 9-11
Starting Feb. 11-13
Starting Feb. 17-21
Starting Feb. 22-23
Featured Programs
Check out our new and trending non-credit course and certificate programs for this semester.
Choose an Area of Study
Choose an Area of Study
- Choose an Area of Study
- AI, Data, & Technology
- Arts & Humanities
- Building Design & Construction
- Entrepreneurship
- Finance
- Fundraising
- Global & Public Affairs
- Hospitality & Events Management
- Human Capital Management
- Leadership & Management
- Marketing & PR
- Publishing, Writing & Media
- Project Management
- Real Estate
- Sports

Why NYU SPS Continuing Education?
Share Your Accomplishments
Take a course to gain specialized, immediately applicable skills. You can also declare candidacy in a certificate (no commitment required) to acquire a wider level of knowledge in a specific field. Our globally recognized digital badges verify your accomplishments on your resume and LinkedIn profile.
Certificate Digital Badges
Earn specialized credentials for career advancement or change. Most certificates consist of three to six courses and declaring candidacy provides a 10% discount on all courses.
Course Digital Badges
Professionally focused classes offer maximum flexibility for a personalized educational experience. Most courses can be applied toward a certificate.
Continuing Education Discounts
Declare your certificate candidacy and enjoy a 10% discount on all future courses. Discounts cannot be combined.
Explore More
NYU SPS also offers programs for high school students, organizations, and those seeking personal enrichment.

The Academy of Lifelong Learning
Personal enrichment courses and a vibrant community open to learners of all ages.
Learn more
Language Proficiency Testing
An affordable, convenient way to demonstrate language competency for credit or career advancement. Based on ACTFL standards, these remotely proctored exams—available in 30+ languages and used by 100+ institutions—deliver results in 2–3 weeks, valid for three years.
Learn More
High School Academy
College and career readiness programs for high school students are offered on weekends and during week-long summer sessions.
Learn more
Design Custom Programs
Executive education for industry leaders and tailored offerings for organizations.
Learn moreContinuing Education Faculty
Meet the expert faculty who teach in our continuing education programs.
I have dozens of former students who are now in senior industry positions."
I have dozens of former students who are now in senior industry positions."
It's only by experimenting and talking to others that you will be able to decide what is useful."
It's only by experimenting and talking to others that you will be able to decide what is useful."
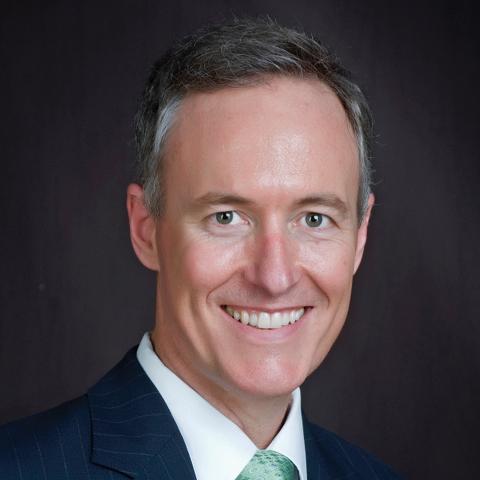
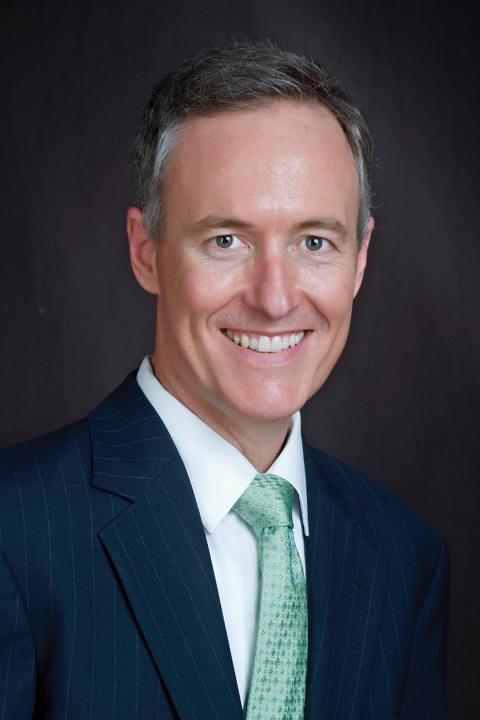
We are in discussions with major endemic and non-endemic brands about bringing in industry leaders for project-based courses."

Jason Chung
Clinical Assistant Professor, Preston Robert Tisch Institute for Global Sport
Read Jason's Story
We are in discussions with major endemic and non-endemic brands about bringing in industry leaders for project-based courses."
There's so much about who you are as a person that makes you better at doing policy or project management, and travel brings that to you."
There's so much about who you are as a person that makes you better at doing policy or project management, and travel brings that to you."
Frequently Asked Questions
Continuing Education (CE)
What is continuing education?
Continuing education refers to courses and programs designed for adult learners who want to gain new skills, enhance their knowledge, or advance their careers. Unlike academic programs where students earn credits toward degrees, CE offers non-credit classes that provide flexible, industry-focused training.
What are continuing education courses?
Continuing education courses are classes designed for people who want to enhance their skills, knowledge, or professional credentials in addition to or instead of formal education.
Is continuing education the same as professional education?
Continuing education encompasses a broad range of learning opportunities for adults who want to develop their knowledge and skills related to their career and/or personal life goals. Professional education focuses on improving skills and knowledge related to a specific profession.
Where can I find continuing education policies and procedures?
Learn more on the continuing education policies and procedures page.
Registration
How do I register for a course?
To enroll for courses online, you will need to create an NYU SPS account. Once you have created an account, you can browse through our courses.
Click the "View" button to learn more about a course.
Click the "Add to cart" button to save it in your cart.
You can then click either the "Continue browsing" button to add more courses, or "Go to cart" to check out.
Please check that your cart is correct, click "Proceed to checkout" and follow the instructions for payment and confirmation.
You can also enroll by phone by calling (212) 998-7150.
Where do I find out how much courses cost?
Tuition varies by course. Follow the link to the course registration page to view specific tuition details.
When do courses open for registration?
Registration dates vary by semester—fall, spring, and summer. View course details for specific open semesters and sign up to be notified of upcoming registration dates.
Are there any discounts for courses or certificates?
Yes, NYU SPS offers the following discounts:
10% off all future courses when you declare certificate candidacy
20% off for NYU alumni who have earned a degree
25% off for individuals over 65
20% off for military-affiliated students
Please note that discounts cannot be combined.
Who can I contact for help or questions about registering for courses?
Contact Registration at sps.info@nyu.edu or (212) 998-7150 for registration assistance or questions.
Certificates
Do I need to apply to enter a certificate program?
No, our certificates and courses are open enrollment. Declare candidacy by submitting a form, then begin the program by signing up for a required course. We provide information on required and elective courses on individual certificate program pages.
Can I transfer my non-credit courses to an NYU degree program?
No, only credit-bearing courses taken at the undergraduate or graduate level can be transferred to NYU degree programs. Certain degree programs may offer degree students course credit for completing specific related certificates.
What are the benefits of declaring candidacy for a certificate?
Declaring candidacy provides a 10% discount on all future NYU SPS continuing education courses and an NYU student photo ID, which grants access to NYU Libraries, NYU Computer Store discounts, and invitations to NYU SPS events.
There is no requirement that students complete a certificate to be eligible for these benefits, although completion brings valuable learning and a certificate digital badge.
Do you offer certifications?
Certifications are typically credentials granted by professional organizations. Several NYU SPS continuing education programs prepare students for (or are aligned with) industry certifications.
Are continuing education certificates worth it?
Yes, earning continuing education certificates is worth it because they can increase your knowledge and skills, enhance your resume, increase your earning potential, and help you stay on top of the latest trends, information, and best practices in your industry and profession.
How much is a certificate?
Certificate pricing varies depending on the program, with most ranging between $2,500 and $12,420. For the most accurate and up-to-date pricing, we recommend visiting the specific certificate page you're interested in.
Digital Badging
What is digital badging?
Globally recognized digital badges verify your course or certificate accomplishments and allow you to showcase them on your resume or LinkedIn profile.
How does digital badging work?
After completing a course, students are awarded a course completion badge or a gold achievement course badge if they earn a grade of B or higher. If a student declares candidacy for a certificate program and achieves a grade of B or higher in all courses, they will receive a certificate badge upon completion.
How do I share my digital badge?
Each digital badge links to a verification page that can be shared with employers, peers, and hiring managers. Once a badge is awarded, we email you with instructions to view the badge and share it on LinkedIn.
Accessibility
Digital Privacy Statement
University Policies
Web Policy
Academic Accreditation
New York University
New York University
New York University
Equal Opportunity and Non-Discrimination at NYU - New York University is committed to maintaining an environment that encourages and fosters respect for individual values and appropriate conduct among all persons. In all University spaces—physical and digital—programming, activities, and events are carried out in accordance with applicable law as well as University policy, which includes but is not limited to its Non-Discrimination and Anti-Harassment Policy.